Did you know that over 50% of the human brain uses visuals to process information? As per a study conducted by MIT, human brains can process the entire image even when we expose our eyes to it for less than 13 milliseconds. 60% of participants in a study could retain information even after three days of seeing an image. All of this indicates the importance of businesses embracing data visualization tools to become more efficient and productive.
Let’s explore how marketers who use search monetization benefit from data visualization in dashboards and reports. But let’s first try to understand what exactly search monetization is.
What is search monetization?
Search monetization is a crucial component of online business strategies. It helps convert search engine traffic into revenue to get maximum return on investment (ROI) and to broaden revenue streams. When businesses use it effectively, they can capitalize on their online presence and drive profitability. Search traffic monetization becomes the cornerstone of their earnings strategy as they learn to transform their search traffic into cash flow generating leads or sales opportunities for profitability.
Search monetization success rests mainly on using real-time reports to monitor and assess performance metrics. Reports provide businesses with valuable insights into the effectiveness of their monetization efforts while identifying areas for improvement and opportunities to tweak strategies. They play a crucial role in decision–making processes, so companies are well-informed about their choices based on empirical evidence.

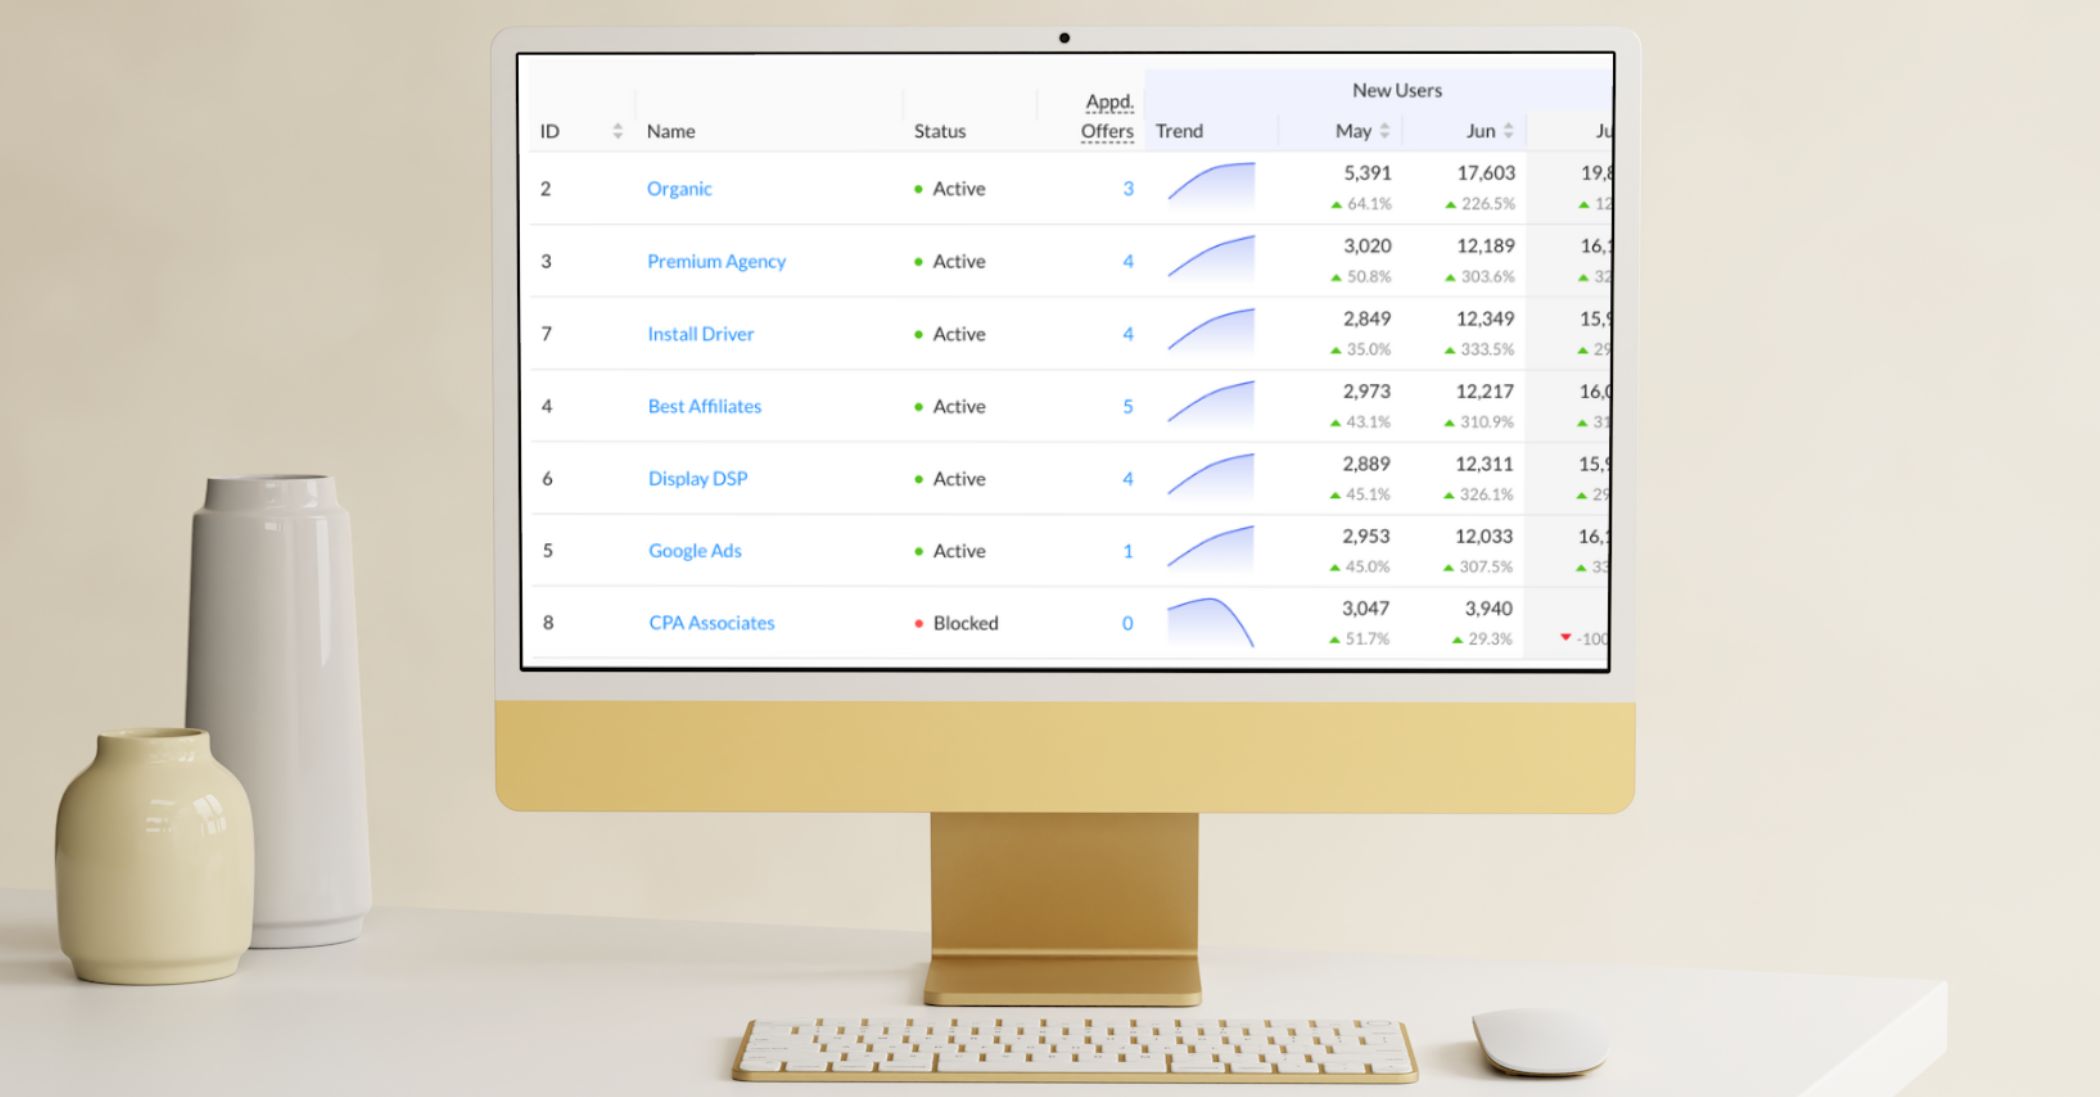
Understanding the importance of data visualization
Data visualization is vital for improving search monetization reports. Visualization tools help stakeholders grasp key metrics more easily. They do this by showing trends, patterns, or anomalies. They simplify complex information into easy-to-understand visuals. These reports allow users to make informed decisions with increased confidence.
Visual reports offer marketers several benefits in terms of search monetization strategies:
- Visualization helps in making information easy to understand for everyone in a company.
- Visual reports allow marketers to identify performance trends or anomalies quickly. Thus, it will enable marketers and businesses to respond promptly to changing market conditions.
- Visual reports boost team collaboration, sharing key metrics and goals.
Other key benefits of using data visualization tools
Data visualization offers many advantages to decision-makers across various industries. When decision-makers use visual reports, they can quickly respond to customer feedback. It also allows them to develop products and services tailored to increase customer satisfaction. Real–time monitoring and control also become possible, providing instant responses to any emerging issues and improving operational efficiency.
Types of reports used in search monetization
Businesses need various reports to help track and measure their performance to succeed in search monetization. These reports should cover metrics related to total revenue growth, ad clicks, monetized searches, traffic, and conversion rates. By analyzing these reports, businesses gain insights for growth. It’s essential to leverage these reports for optimization and success.
What are some data visualization techniques?
There are various data visualization techniques. You can select data visualization techniques that appeal to you and customize their features to fit your needs. Here are some of the popular ones.
Charts
To show data changes, use various charts like bar or pie charts. Bar charts show relationships over time, while pie charts display component proportions.
Plots
Plots help visualize data sets in 2D or 3D spaces, showing relationships and parameters. Marketers commonly use options like scatter and bubble plots for large data. Box plots can aid with extensive data analysis, too.
Maps
Maps are hot in different industries for visualizing data. They pinpoint stuff on objects like geographical maps or building plans. The trending map types are dot distribution, heat maps, and cartograms.
Diagrams and matrices
Diagrams show complex data relationships visually, making data connections clear. They link different data types in one visual format.
Matrix visualization is an excellent way to see connections in data. It’s great for understanding correlations between different data sets.

How to craft effective search monetization reports
If you want to customize search monetization reports, careful attention and emphasis are needed to provide insights that drive profitability. It’s essential to follow some important tips and best practices to develop visually engaging and informative reports.
Audience
You should first consider who will be reading the report and tailor its contents and presentation style accordingly.
Keep it simple
Use simple English; avoid technical jargon where possible so that even a layperson can easily understand the information you present in the reports.
Visuals that are engaging
Use visual elements such as charts, graphs, and tables to make data digestible and engaging for stakeholders.
Ensure that the reports are coherent
Logically, arrange all the information. Use headings, subheadings, and bullet points to improve readability and navigation. Finally, it offers insight and raw data to help stakeholders fully grasp its implications and make data-driven decisions based on the insights provided.
Successful search monetization reports typically present vital metrics, trends, and actionable insights in an engaging format.
Examples may include:
- Revenue breakdowns by data sources or channels.
- Conversion rate trends over time.
- Traffic analysis per channel or benchmark comparisons against competitors.
- Performance comparisons against specific benchmarks or competitors.
By providing this data visually appealingly, businesses can enable their stakeholders to identify opportunities for optimization and growth using these methods. The best part is that you can make eye–appealing reports using data visualization tools like the Swaarm search monetization platform.
How to interpret and analyze reports effectively
Did you know that, as per Harvard Business Review, bad data costs the United States almost 3 trillion dollars? Any data becomes useless when you do not present it well.
Effectively interpreting and analyzing reports is essential for driving profitability in search monetization. Marketers and businesses should create a solid framework for reviewing and acting upon report data, with regular analysis sessions built into their workflow schedule.
Identify and track key metrics
At these sessions, stakeholders should examine critical metrics, identify trends or patterns, and brainstorm improvement strategies. Creating an environment of data-driven decision-making will enable businesses to harness reports’ power to optimize search monetization marketing campaigns and increase return on investment.
Learn from case studies
Case studies offer businesses real-world examples of leveraging reports to drive profitability in search monetization. By studying other companies’ experiences, stakeholders can gain insight into best practices, potential pitfalls, and innovative approaches for success. Case studies may highlight specific actions or initiatives that affect critical metrics like revenue, conversion rates, or customer engagement; by learning from such examples, marketers, and businesses can enhance their strategies and increase profitability in an ever more competitive online landscape.
Invest in the right technology and tools
Businesses seeking to generate reports in search monetization have access to a wide range of tools and technologies for report generation. Popular options include data analytics platforms such as Swaarm search monetization tool and Google Analytics, reporting software like Tableau or Power BI, and custom solutions explicitly tailored for specific business needs.
How do you pick the right data visualization tools?
When choosing a suitable reporting or data visualization tool for their requirements, companies should consider factors like ease of use, flexibility, scalability, and integration capabilities as a guide when selecting their ideal reporting solution; choosing such an instrument can streamline reporting processes while unlocking actionable insights to drive profitability in search monetization.
Conclusion
In conclusion, integrating data visualization tools in search monetization strategies is imperative for businesses aiming to drive profitability. By converting complex data into visually engaging reports, stakeholders can easily interpret key metrics and make informed decisions to optimize their campaigns.
Leveraging various reports, including revenue breakdowns and conversion rate trends, allows businesses to identify growth opportunities and respond promptly to market changes. With effective interpretation and analysis of reports supported by case studies and the right tools, companies or marketers can maximize their return on investment and stay competitive in the dynamic landscape of search monetization.